Working with World Bank Data in R

Although I generally stick to Python, I am going to go off on a tangent about statistics, data sets and R. You’ve been warned.

Getting the data

Last week, the World Bank released some of its underlying data that it uses as development indicators. The data is fairly clean and easy to work with. I grabbed the USA data in Excel format and transposed it (using “paste special”) so that each year was a row instead of having the years as columns. Then I saved it as a CSV file on my desktop.

Working with the data in R

R is a programming language that focuses on statistics and data visualization. Unlike Python, R has a number of useful functions for statistics as built-ins to the language. These features allow you to easy find means, minimums, maximums, standard deviations, summarize data sets, plot graphs and more. Working with the data is very interesting and it provides a good way to learn R.

First off, you can read in the CSV file saved easily.

The variable usa contains all columns of data and the columns can be accessed easily:

Plotting with R

Visualizing the data is the real interesting aspect and this is where R really shines. First we need to get the columns we want to graph.

There are some missing data points in both the population and energy use columns for the most recent years. It is possible that that data hasn’t yet been collected and verified. By coercing the data into an integer vector any non-integer data points will be converted into the R NA type. While similar to null or Python’s None, this type indicates that the data is not available and it will be ignored in plotting. Once the data is ready, it can be plotted easily.

When I saw the resulting graph I thought to myself: WOW, that’s a lot of energy. I don’t think I use multiple tons of oil per year, but I assume this also includes industrial, commercial and military usage. Still, that’s a lot of energy. It’s interesting to note that the peak of US energy usage was 1978 and then there’s the subsequent decline due to the energy crisis. The next thing I thought about was how energy usage has leveled off while population has continued to grow. So I decided to put population on the same chart.

US Energy Usage
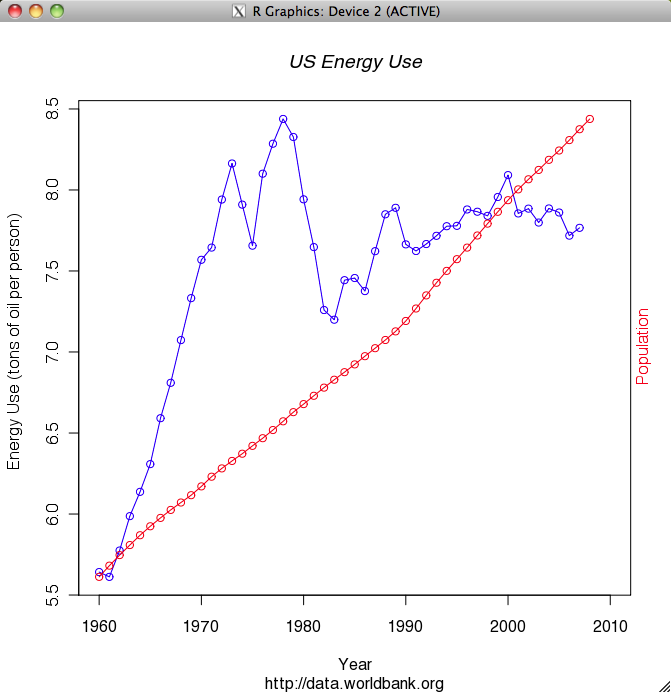
While the leveling of energy usage may not be as amazing as I thought due to the fact that a significant percentage of it must be industrial use which is probably declining, it is still interesting and fairly impressive. While the population has continued to grow fairly linearly, energy usage is flat or slightly less than it was 35 years ago. I guess those slightly more efficient water heaters and refrigerators are paying off.

Updates April 2010 Edition

Django tickets

There’s been only a little movement on the ticket (#13101) I patched for 1.2. However, there’s been some new developments on the ticket (#10809) I patched regarding authentication with mod_wsgi. There’s been a suggestion to add group based authorization to Django’s mod_wsgi auth handler. There’s still some debate as to whether to use Django groups or Django permissions.

Edit (November 30, 2012): Issue #10809 finally made it into trunk and the release notes for Django 1.5.

django-pyodbc is dead?

In a previous post, I talked about getting involved in django-pyodbc development. We are using django-pyodbc at work but the project is languishing a little bit. The project has never had a formal release, the documentation (other than source documentation) is a little light, and despite patches being submitted to get the code in shape for Django’s upcoming 1.2 release, nothing has been checked in by the developers. In fact, there’s been nothing on the project from the developers since January. I emailed the developers a few days ago offering to help and I haven’t heard anything back yet. I’d much rather keep the project together, but if I continue to get nothing I will probably branch the code line and begin development and maintenance. I’m not looking forward to having to find a Windows box on which to setup multiple versions of SQL Server but I’m hoping to be able to virtualize it.

Edit (June 23, 2010): The developers have gotten involved again and I killed my fork of the project.

RPC4Django updates

I’m planning to put some effort into RPC4Django this weekend and make a release in the next week or two. The main features I’m looking at is the existing blueprint in Launchpad to handle authentication out of the box. Other than that, I got a little feedback on the HTTP access control functionality back in January that I need to test. I also plan to rip out the existing documentation and go to a Sphinx based system. We’ve been using Sphinx at work and I’ve been very impressed with its capabilities.

Why You Should Be Using Pip and Virtualenv

In a previous post, I promised to write about Pip and Virtualenv and I’m now finally making good. Others have done this before, but I think I have a little to add. If you develop a Python module and you don’t test it with virtualenv, don’t make your next release until you do.

Configuring the environment

Virtualenv creates a Python environment that is segregated from your system wide Python installation. In this way, you can test your module without any external packages mucking up the result, add different versions of dependency packages and generally verify the exact set of requirements for your package.

To create the virtual environment:

This creates a directory testarea/ that contains directories for installing modules and a Python executable. Using the virtual environment:

Sourcing activate will set environment variables so that only modules installed under testarea/ are used. After setting up the environment, any desired packages can be installed (from pypi):

Packages can also be uninstalled, specific versions can be installed or packages can be installed from the file system, URLs or directly from source control:

Pip is worth using over easy_install for its uninstall capabilities alone, but I should mention that pip is actively maintained while setuptools is mostly dead.

When you’re done with the virtual environment, simply deactivate it:

Do it for the tests

Testing with virtualenv
While the segregated environment that virtualenv provides is extremely well suited to getting the correct environment up and running, it is just as well suited to testing your application under a variety of different package configurations. With pip and virtualenv, testing your application under three different versions of Django is a snap and it doesn’t affect your system environment in the slightest.

Dependencies made easy

My favorite feature of pip is the ability to create a requirements file based on a set of packages installed in your virtual environment (or your global site-packages). Creating a requirements file can be done automatically using the freeze command for pip:

Wsgiref will always appear in pip’s output. It is a standard library package that includes package metadata. The requirements file is used as follows:

The requirements file can be version controlled both to aid in installation and to capture the exact versions of your dependencies directly where they are used rather than after the fact in documentation that can easily become out of date. The requirements file can be used to rebuild a virtual environment or to deploy a virtual environment into the machine’s site-packages. Pip and virtualenv are exceptionally easy to use and there’s really no excuse for a Python packager not to use them.

Note: I’m working on a fairly large sized application for work. When it is finished, I will release a post-mortem that will also function as an update to my post about packaging and distributing.